Alaska Arctic NDVI and Phytomass
- AATVM
- Vegetation
- Bioclimate Subzones
- Floristic Provinces
- AVHRR
- Elevation
- Lake Cover
- Physiography
- NDVI and Phytomass
- Substrate Chemistry
- Literature

| Available data: | ||||
| |
GE |
Metadata |
GIS data |
GIS data |
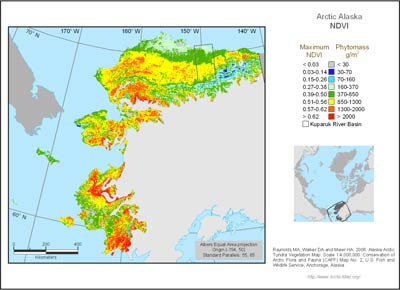
The normalized difference vegetation index (NDVI) shows relative maximum greenness. This image was created from the same data as the AVHRR base image. Vegetation greenness is calculated as: NDVI = (NIR - R)/(NIR + R), where NIR is the spectral reflectance in the AVHRR near-infrared channel (0.725-1.1 µm) where light-reflectance from the plant canopy is dominant, and R is the reflectance in the red channel (0.5-0.68 µm), the portion of the spectrum where chlorophyll absorbs maximally. The NDVI values were grouped into eight classes related to biomass. Red and orange areas in the NDVI image are areas of shrubby vegetation with high biomass, and blue and purple areas are mostly barren areas with low biomass. The relationship between NDVI and aboveground plant biomass (phytomass) as shown in the legend was calculated from clip harvest data (Walker et al. 2003).


